The importance of plastics in the economy has consistently grown and is expected to continue to grow. However, the negative impact of plastic on the environment and climate is also increasing.
Action on plastics was identified as a priority in the Circular Economy Action Plan (CEAP, 2020). This document is one of the main building blocks of the European Green Deal, Europe’s new agenda for sustainable growth. CEAP announces initiatives, legislative and non-legislative measures along the entire life cycle of products. It promotes circular economy processes, encourages sustainable consumption of plastics. Aims to plastic waste prevention, improving recycling quality and reducing impacts from waste and littering of plastics.
Three EU directives dealing with objectives, targets and measures related to plastic waste, and are subject of HRPWD Project, are Directive 94/62/EC on Packaging and Packaging Waste; SUP Directive (EC) 2019/904 on the reduction of the impact of certain plastic products on the environment, and Directive (EU) 2015/720 of the European Parliament and of the Council of 29 April 2015 amending Directive 94/62/EC as regards reducing the consumption of lightweight plastic carrier bags. General framework is set by Waste Framework Directive 2008/98/EZ.
For the purpose of monitoring attainment to the targets and implementation of the measures, it is expected from each member state to transpose provisions of the directives into national legislation and set up monitoring system necessary to provide data which will be used for reporting and in decision making process. According to each of three directives, it is necessary to submit to the European Commission/Eurostat, on annual basis, the data on product consumption, waste recycling, and other data proving implementation of the prescribed measures.
In Croatia, Ministry of Economy and Sustainable Development (MESD) creates policies and legislative acts regarding waste management. Data collection, monitoring and reporting are within the competencies of the MESD Institute for Environment and Nature. MESD Institute is collecting data on types and quantities of waste produced, collected and treated, in Environmental Pollution Register (ROO), mantains the Waste Management Information System and is responsible for reporting to EC / Eurostat waste statistsics and data.
Environmental Protection and Energy Efficiency Fund is organizing and operating “producer responsibility schemes” (i.a. for packaging, and shal also set-up scheme for fishing gear), as well as collecting the data under this schemes.
Most important provisions regulating plastic waste issues are prescribed in Act on Waste Management (Official Gazette 84/2021), Ordinance on packaging and packaging waste (OG 88/15, 78/16, 116/17, 14/2020, and 144/20 - new ordinance is under preparation) and Ordinance on Waste Management (NN 106/2022). For data collection of importance is also the Ordinance on Environmental Pollution Register (OG No 3/2022).
In the Republic of Croatia, plastics industry records a continuous growth of registered companies, employees and production. Within the framework of the HRPWD Project, the consumption of plastic in 2021 was estimated at 413,876 tons, or 107 kg per inhabitant. Share of packaging sector in total consumption is about 30 %.
Within the framework of the HRPWD Project, the total amount of plastic waste generated is estimated at 306,030 tons, which includes the share of plastic in mixed municipal waste. The estimated average share of plastic in mixed municipal waste is 16.3 %, which for 2021 amounts to 163,795 tons. Thus, in the total amount of plastic waste generated, the largest share is waste plastic that is a part of mixed municipal waste (53.5 %), while the remaining part is made up of separately collected plastic (46.5 %) (Figure 1).
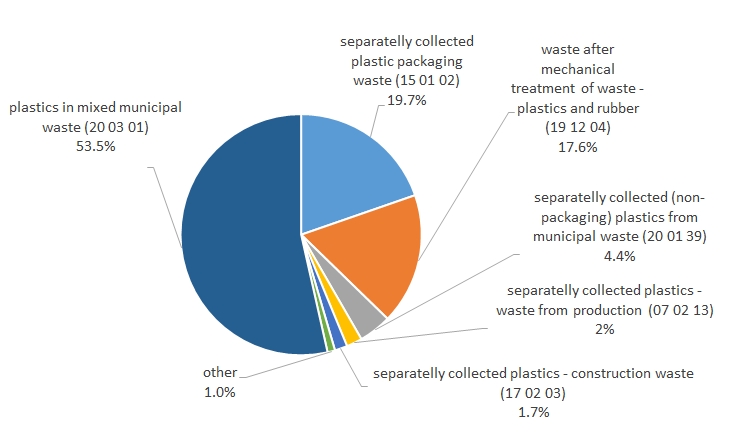
Figure 1. Share in total plastic waste, by waste type
There is a total of 142,235 tons of plastic waste that is collected separately (07.4 category, EWC-Stat). In that plastic waste, the largest share is of plastic packaging waste, 42.4 % and secondary waste from waste plastic and rubber processing, 37.8 %.
Considering individual sectors, the most is collected separately from households and the service sector, consequently causing an increase of the secondary waste amounts in the sector (E) of waste management.
Waste management permit for plastic waste recovery operations which are considered final (R1-R11 operations) has 69 companies, for 86 locations.
The waste generated in the territory of the Republic of Croatia in 2021 was partly processed on the territory of the Republic of Croatia (96,178 t), partly exported for recovery operations (38,452 t), while the remaining amounts of generated waste were temporarily stored or their flows remained unknown (7,605 t) (Figure 2).
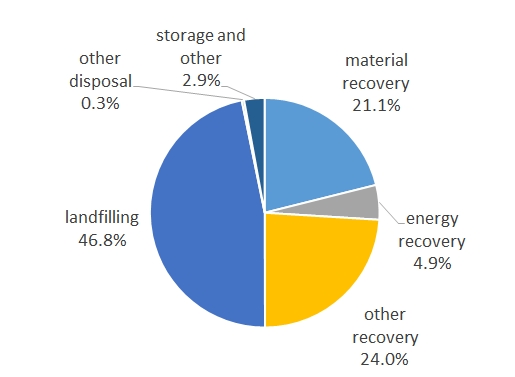
Figure 2. Share in treated waste in 2021, by type of recovery/disposal
In total amount of plastic waste (which includes a share of plastic in mixed municipal waste), the largest share of 46.8 % is disposed of in landfills. Energy recovery share is 4.9 %, 21 % is materially recovered (recycled), while other (non final) recovery procedures, including sorting, account for 24 %. Share of 3.2 % was remaining waste sent for other disposal, storage, etc.
Plastic waste that was collected separately (142,235.3 t, EWC-Stat category 07.4) was mostly recovered. A share of 45.4 % was materially recovered, with the largest share related to the R3 operation. This operation was used mostly for recovery of packaging waste and secondary waste generated after plastic processing. For energy recovery was used 10.5 % of plastic waste, mainly secondary waste.
Other recovery operations make up a share of 35 %, mostly includes sorting and other pre-treatments that are not considered the final recovery. Only 3.1 % of the separately collected plastic waste was disposed at the landfills, and the rest was stored in temporary storages or disposed differently (2.9 %). In treated waste that was collected separately, the share of exported waste was 27 %, where waste was exported for recovery, by type mainly secondary waste and packaging plastic waste.
Considering municipal waste only, in 2021 separately collected municipal plastic waste amounted to 73,707 t. The largest share of municipal plastic waste was collected in the City of Zagreb (34 %), followed by Zagreb County (12 %) and Istria County (8 %) (Figure 3).
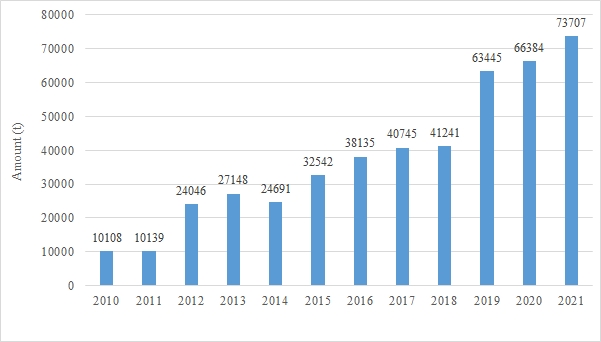
Figure 3. Amount of separately collected municipal plastic waste in the period from 2010 to 2021
Regarding SUP Directive (EU) 2019/904 issues, and based on the survey conducted within the framework of the HRPWD Project by MINGOR, the total amount of fishing gear containing plastic, which is used in marine fishing and was put on the market in 2021, is estimated at 590 tons. The share of plastic is estimated at 60 %, the share of metal at 21 %, and the share of rubber at 19 %. The amount of waste fishing gear containing plastic, which is generated by marine fishing activities, is estimated at 223 tons per year, and the share of plastic in this waste is 66 %.
Although marine litter has been measured since 2017, the results are not sufficient to estimate the amount of waste that ends up in the sea in any way; from land and sea. The Republic of Croatia does not have a systematic model of disposal of marine litter. Out of 119 most important landing places/fishing ports, only 6 % have containers for separate collection of fishing gear.
In terms of the Directive 94/62/EC on packaging and packaging waste, the results of the analyses carried out as part of this HRPWD Project indicates that the system of monitoring packaging placed on the market of the Republic of Croatia requires revision and improvement.
Within the project, it was estimated that a total of 122,512 t of plastic packaging was placed on the Croatian market in 2021. Additionally, the total amount of plastic packaging was estimated at 31.72 kg/inhabitant/year, which is at the level of the estimated average for EU27 countries.
More information is available in the Report on plastic waste and other project results.